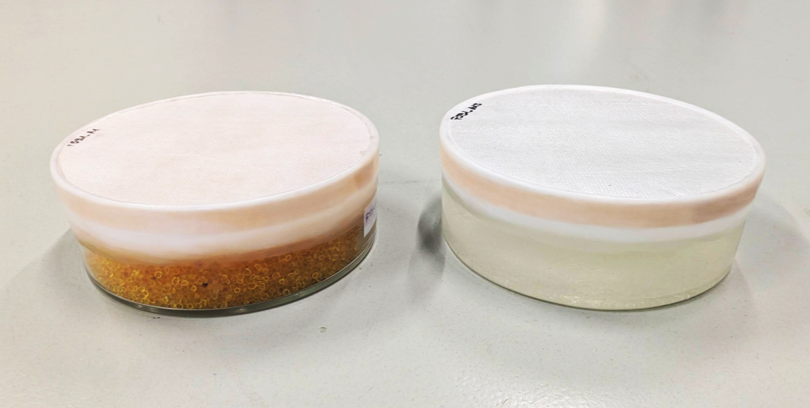
The water vapour diffusion resistance factor (µ-value) of a material indicates how much more resistant the material is to vapour diffusion compared to stagnant air. The µ-value of a given material can be determined by exposing a material specimen to different relative humidities on both sides and measuring the resulting vapour flow through the specimen. If the specimen is a thin layer, such as a membrane, it can be applied over the opening of an appropriate cup. Inside the cup, the desired relative humidity can be achieved by a drying agent or a suitable salt solution, while outside the cup the relative humidity may be maintained by a climate chamber.
During the measurement, different humidity levels exist along the material’s cross-section, varying continuously between the humidity levels on the two surfaces. In materials with moisture-dependent diffusion resistance, such as humidity-adaptive vapour retarders, these different humidities correspond to different µ-values. On its way through the cross-section, the vapour flow encounters this sequence of different µ-values. The intensity of the resulting vapour flow indicates the total resistance of the specimen in this humidity state, but it is not directly possible to read out the involved individual resistances corresponding to the individual humidities in different parts of the specimen.
The total resistance µCup of the specimen is the mean value (more precisely: the „harmonic mean“) of the µ-curve in the applied humidity range. In the following example the relative humidities 10 % and 70 % which in this material correspond to the µ-values 5.9 and 3.1 have been applied to the specimen surfaces. The total resistance is the mean value of the curve between these limits, and in this case is µCup = 5.0:
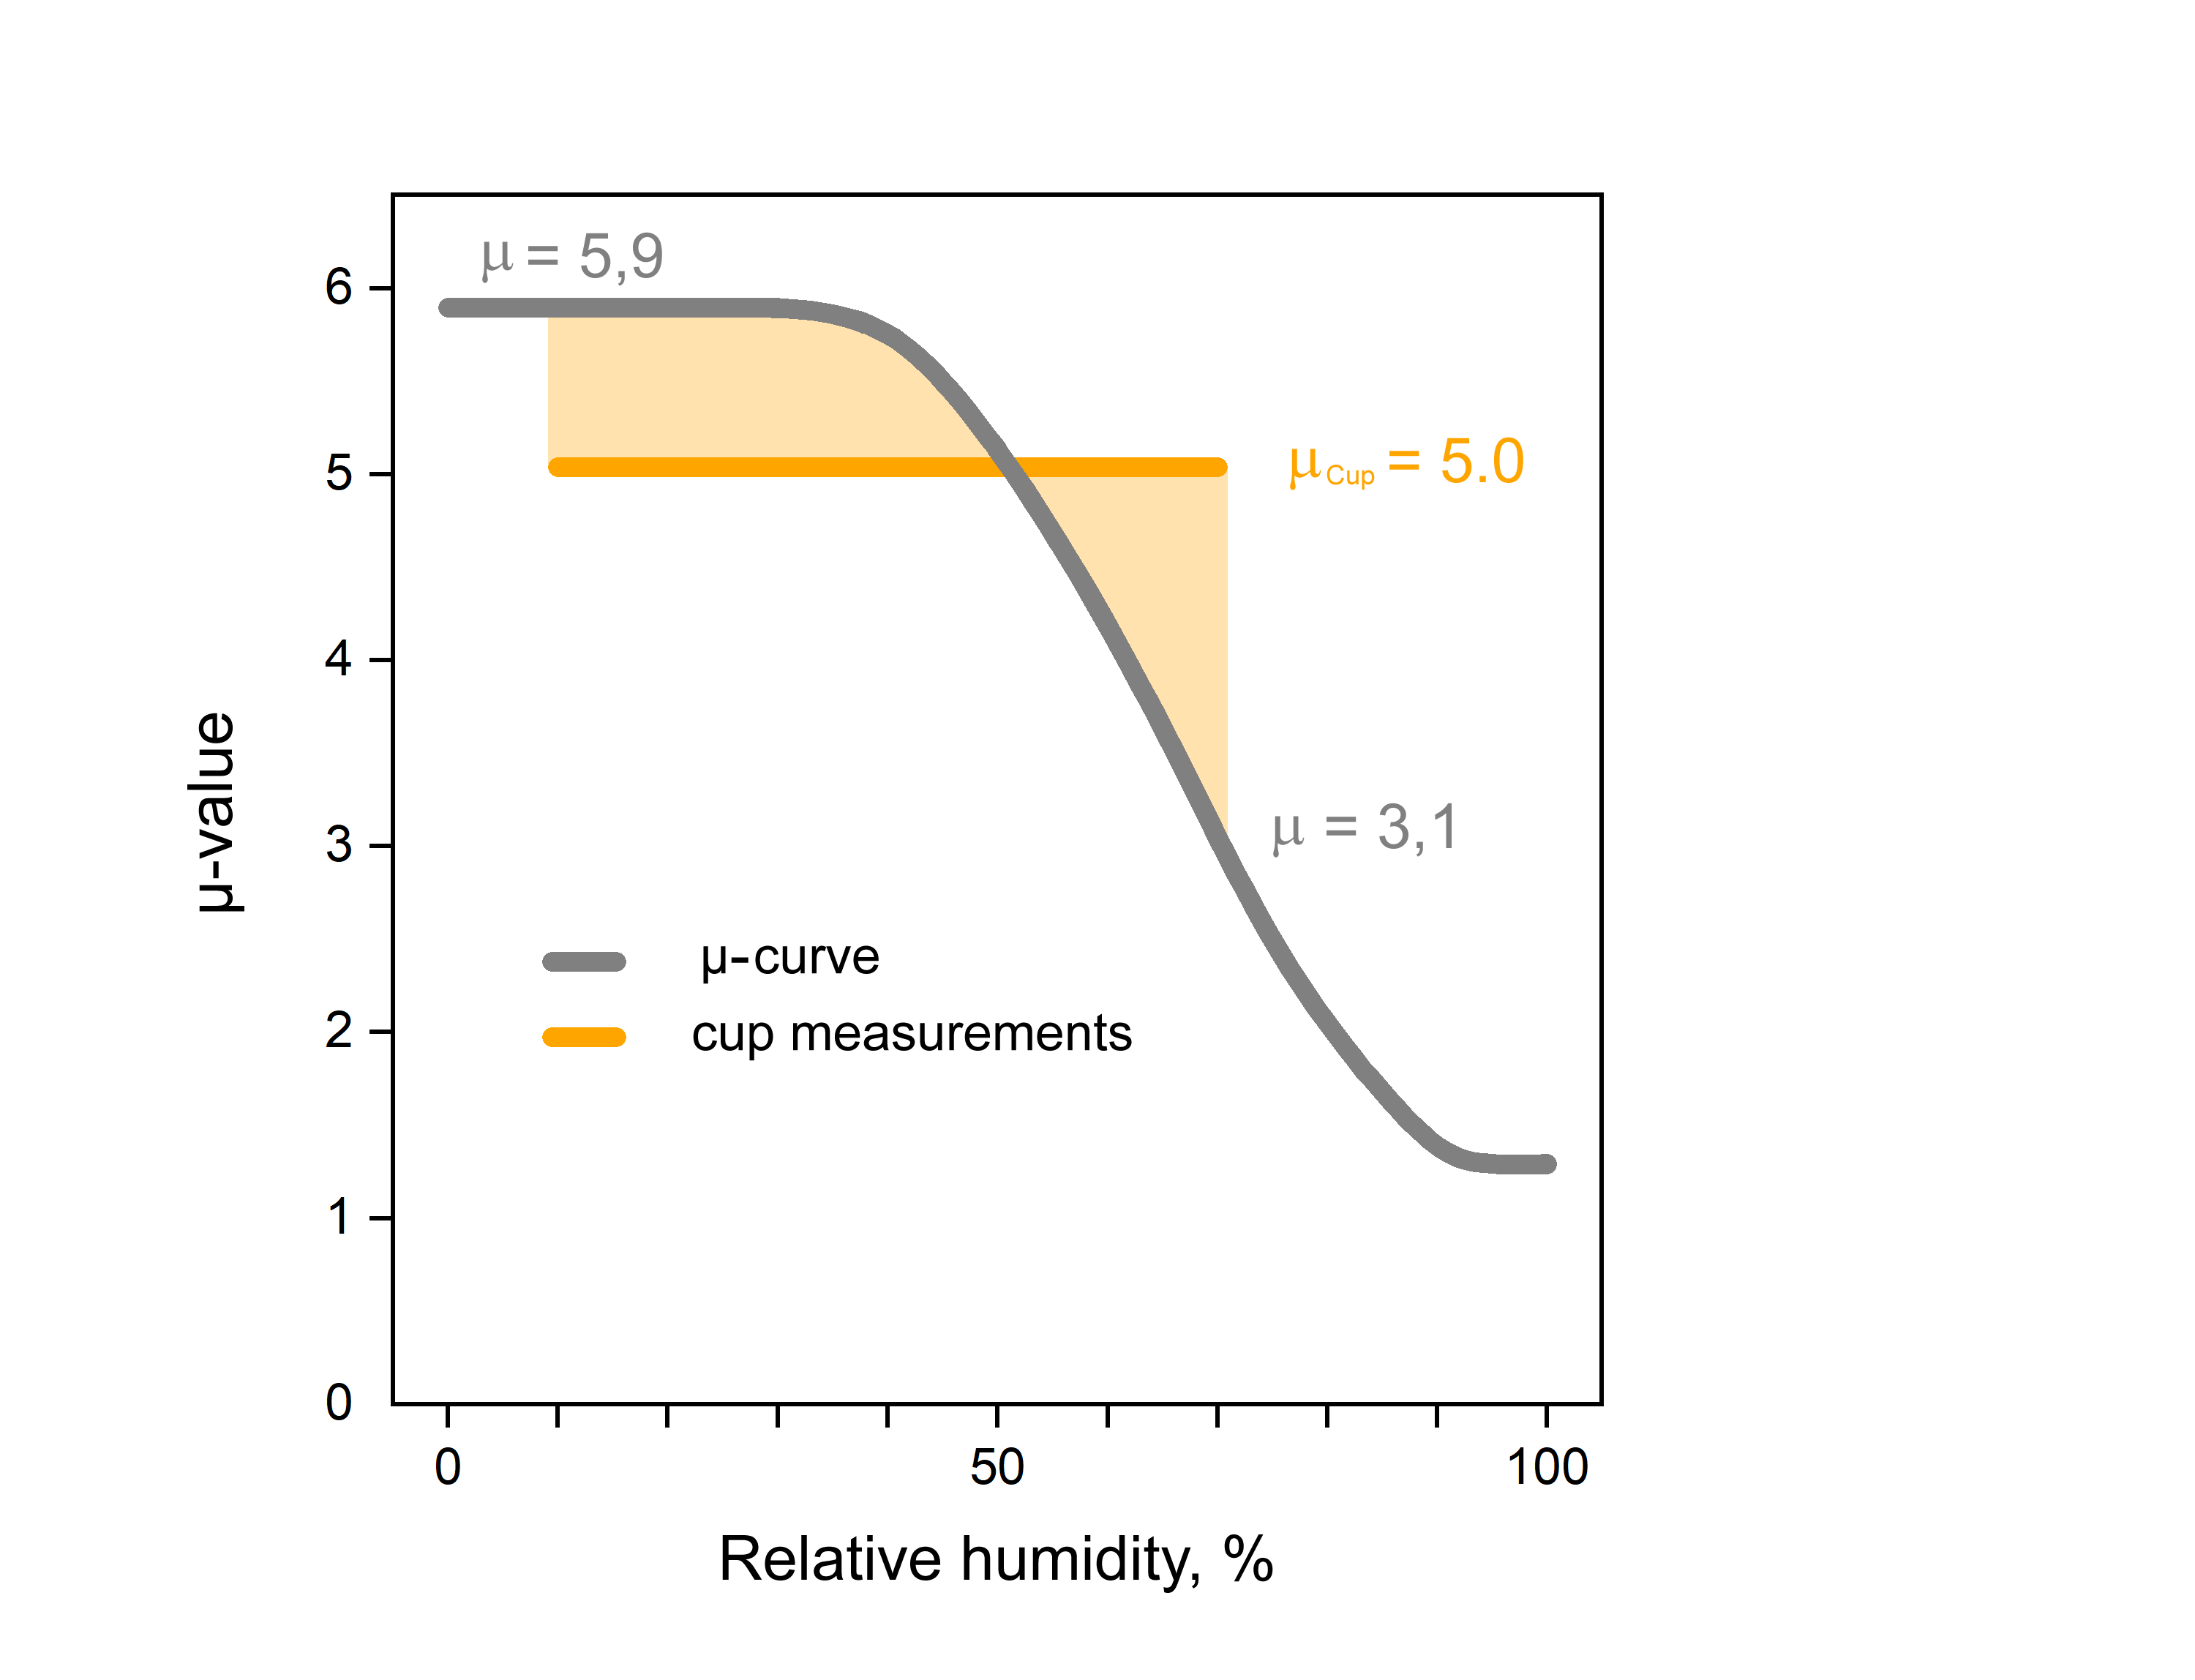
The information µCup = 5.0 describes the average resistance level in the humidity range applied in this individual measurement. However, usually the task is to determine the point-by-point shape of the µ-curve with as much detail as possible. Also, the curve may be required for all humidities between 0 % and 100 %. These tasks can be achieved by combining the results of cup measurements with different moisture ranges.
It is often assumed that the individual points of the µ-curve can be found if the total resistances µcup provided by the cup measurements are plotted against the mean humidity of the applied humidity ranges. However, in general this is not true for strongly non-linear curves, as shown by the following diagram.
Cup measurements in which humidity ranges with the same mean value (here 40 %) but increasing width are applied, result in decreasing total resistances µcup, because with increasing width ever larger portions of the decreasing part of the curve are included in the range, while the constant part on the left-hand side of the curve always provides the same contribution to the mean value:
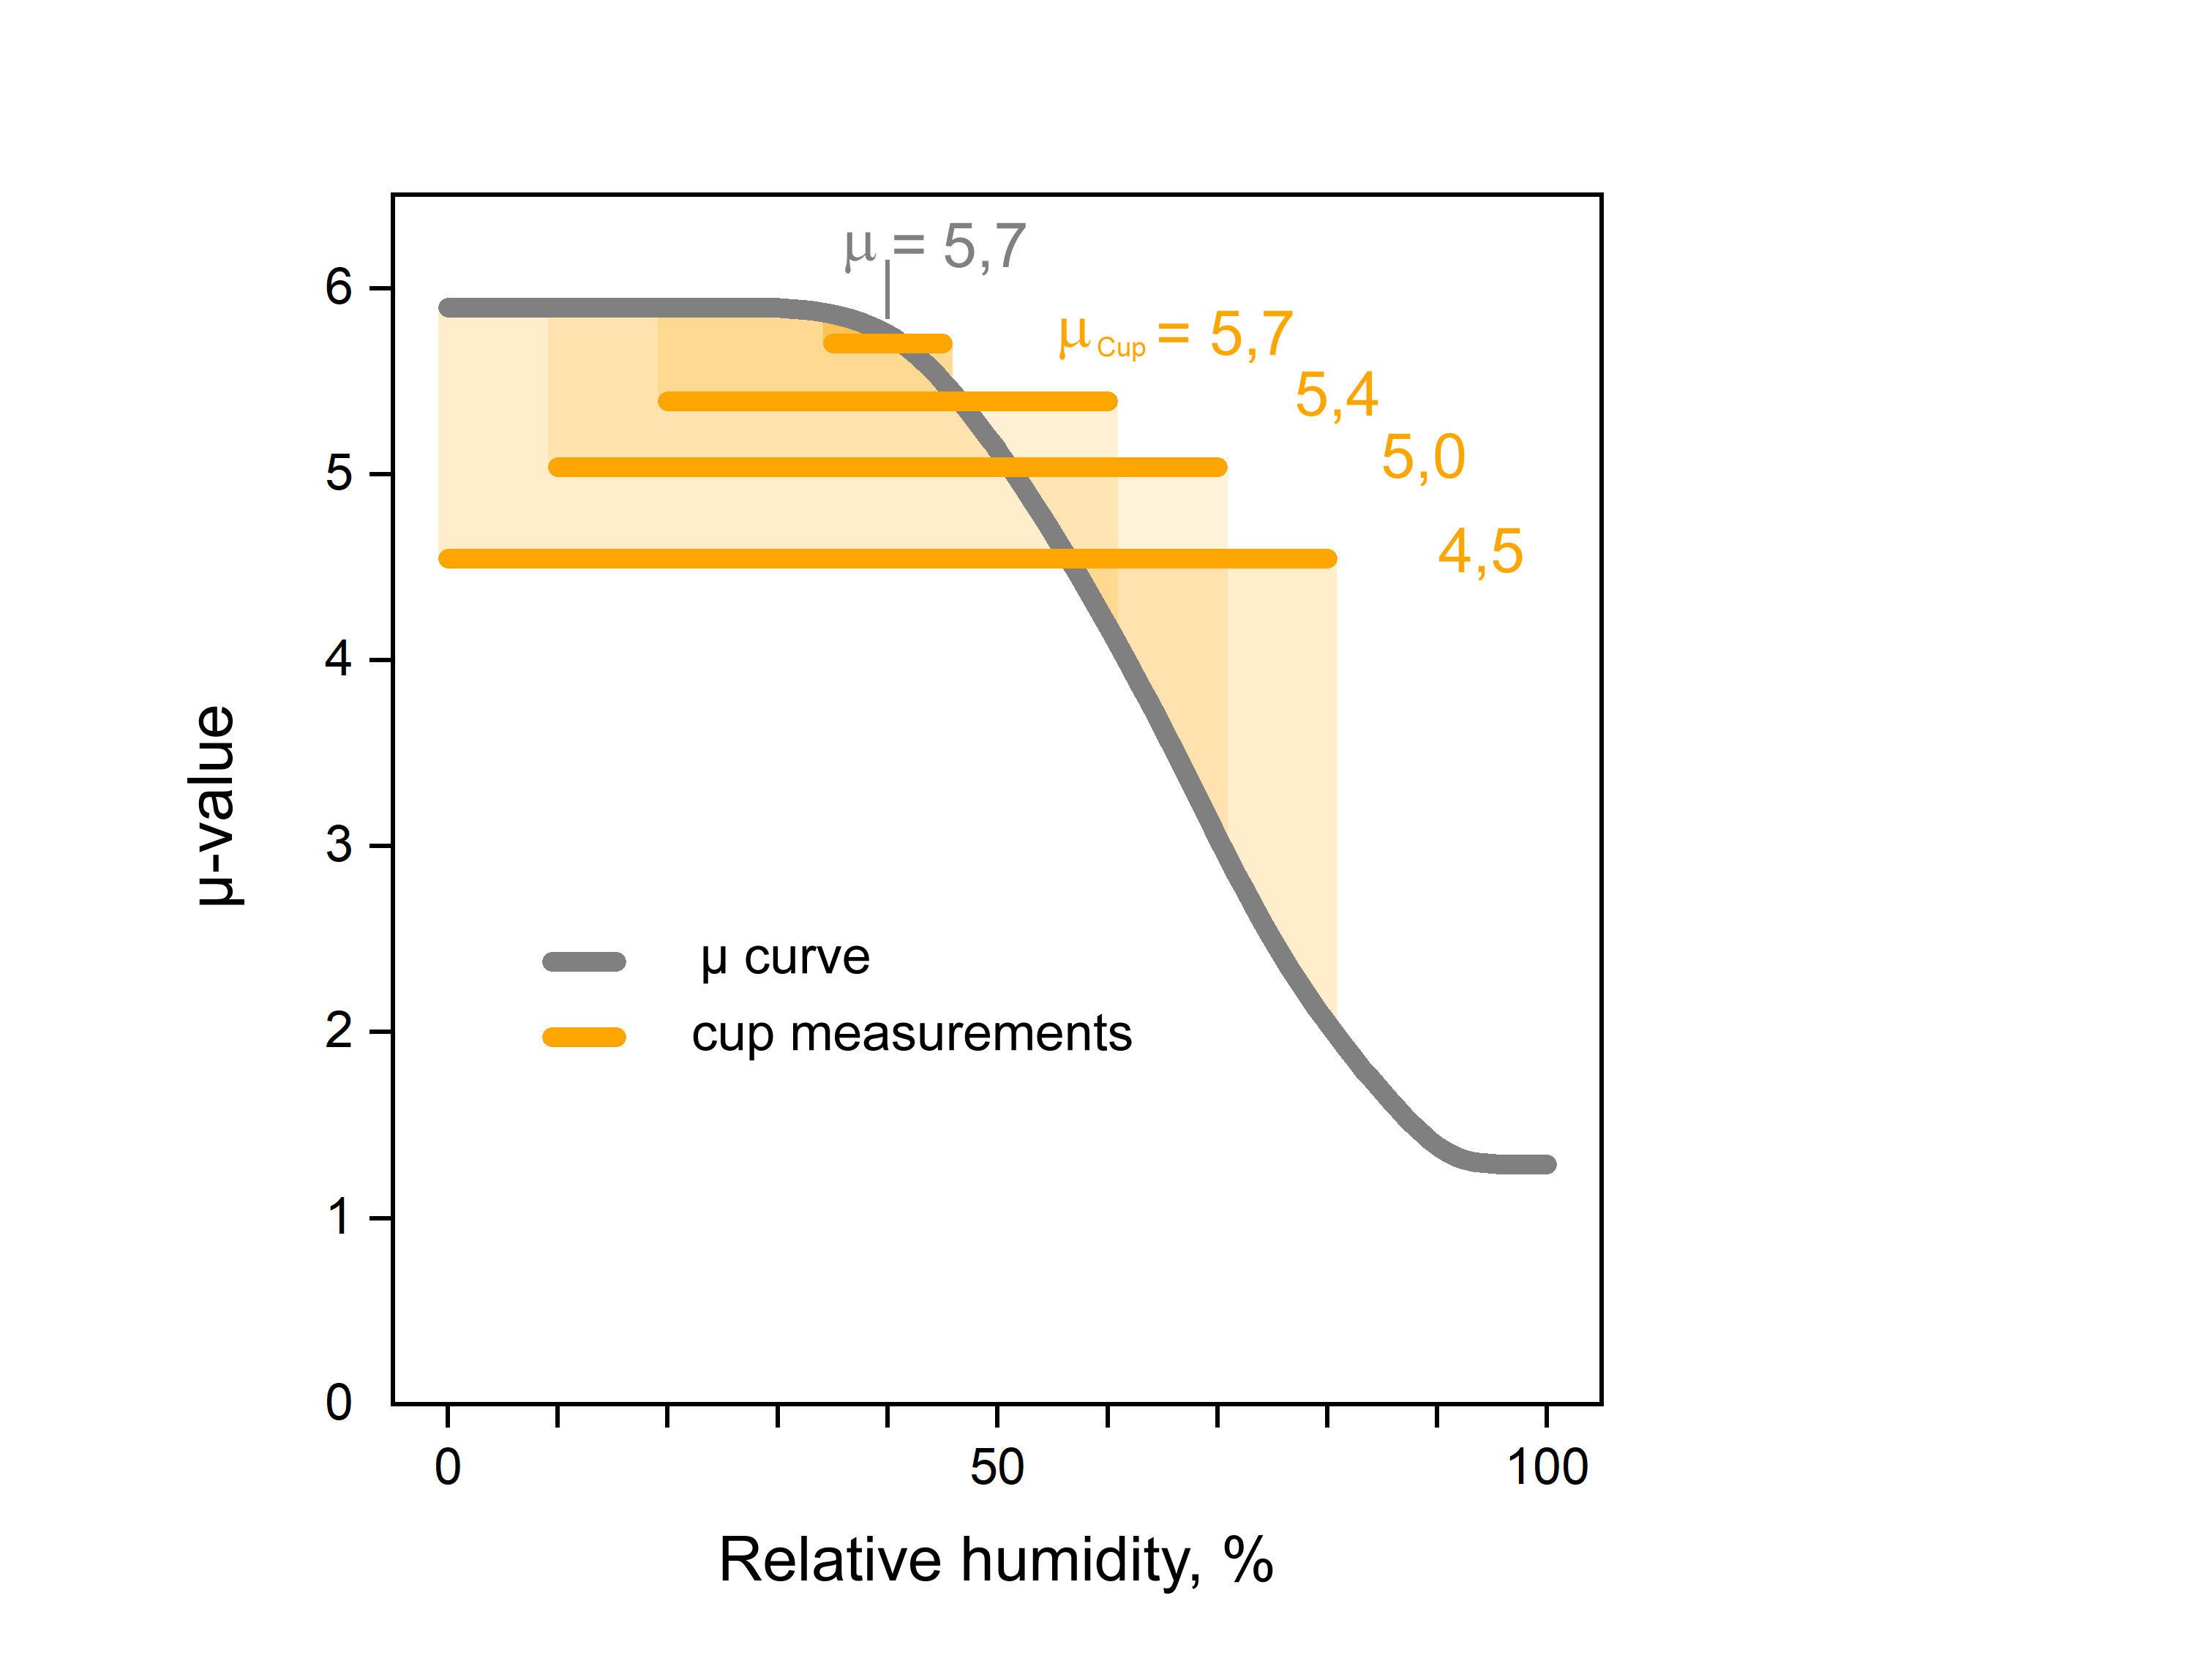
In this example, a cup measurement with the narrow applied humidity range between 35 % and 45 % yields a total resistance µcup of 5.7 which is practically identical with the curve value at 40 %, while a measurement applying 0 % and 80 % has the same mean humidity but a total resistance of only µcup = 4.5.
Thus, in general the total resistance µcup indicated by a cup measurement is not identical with the individual µ-value at the mean applied humidity. Furthermore, the extent of the deviation depends on the width of the applied humidity range.
In the following diagram, the red curve shows a misleading µ-curve which might result from an uncritical plot of the cup measurements against the respective mean humidity:
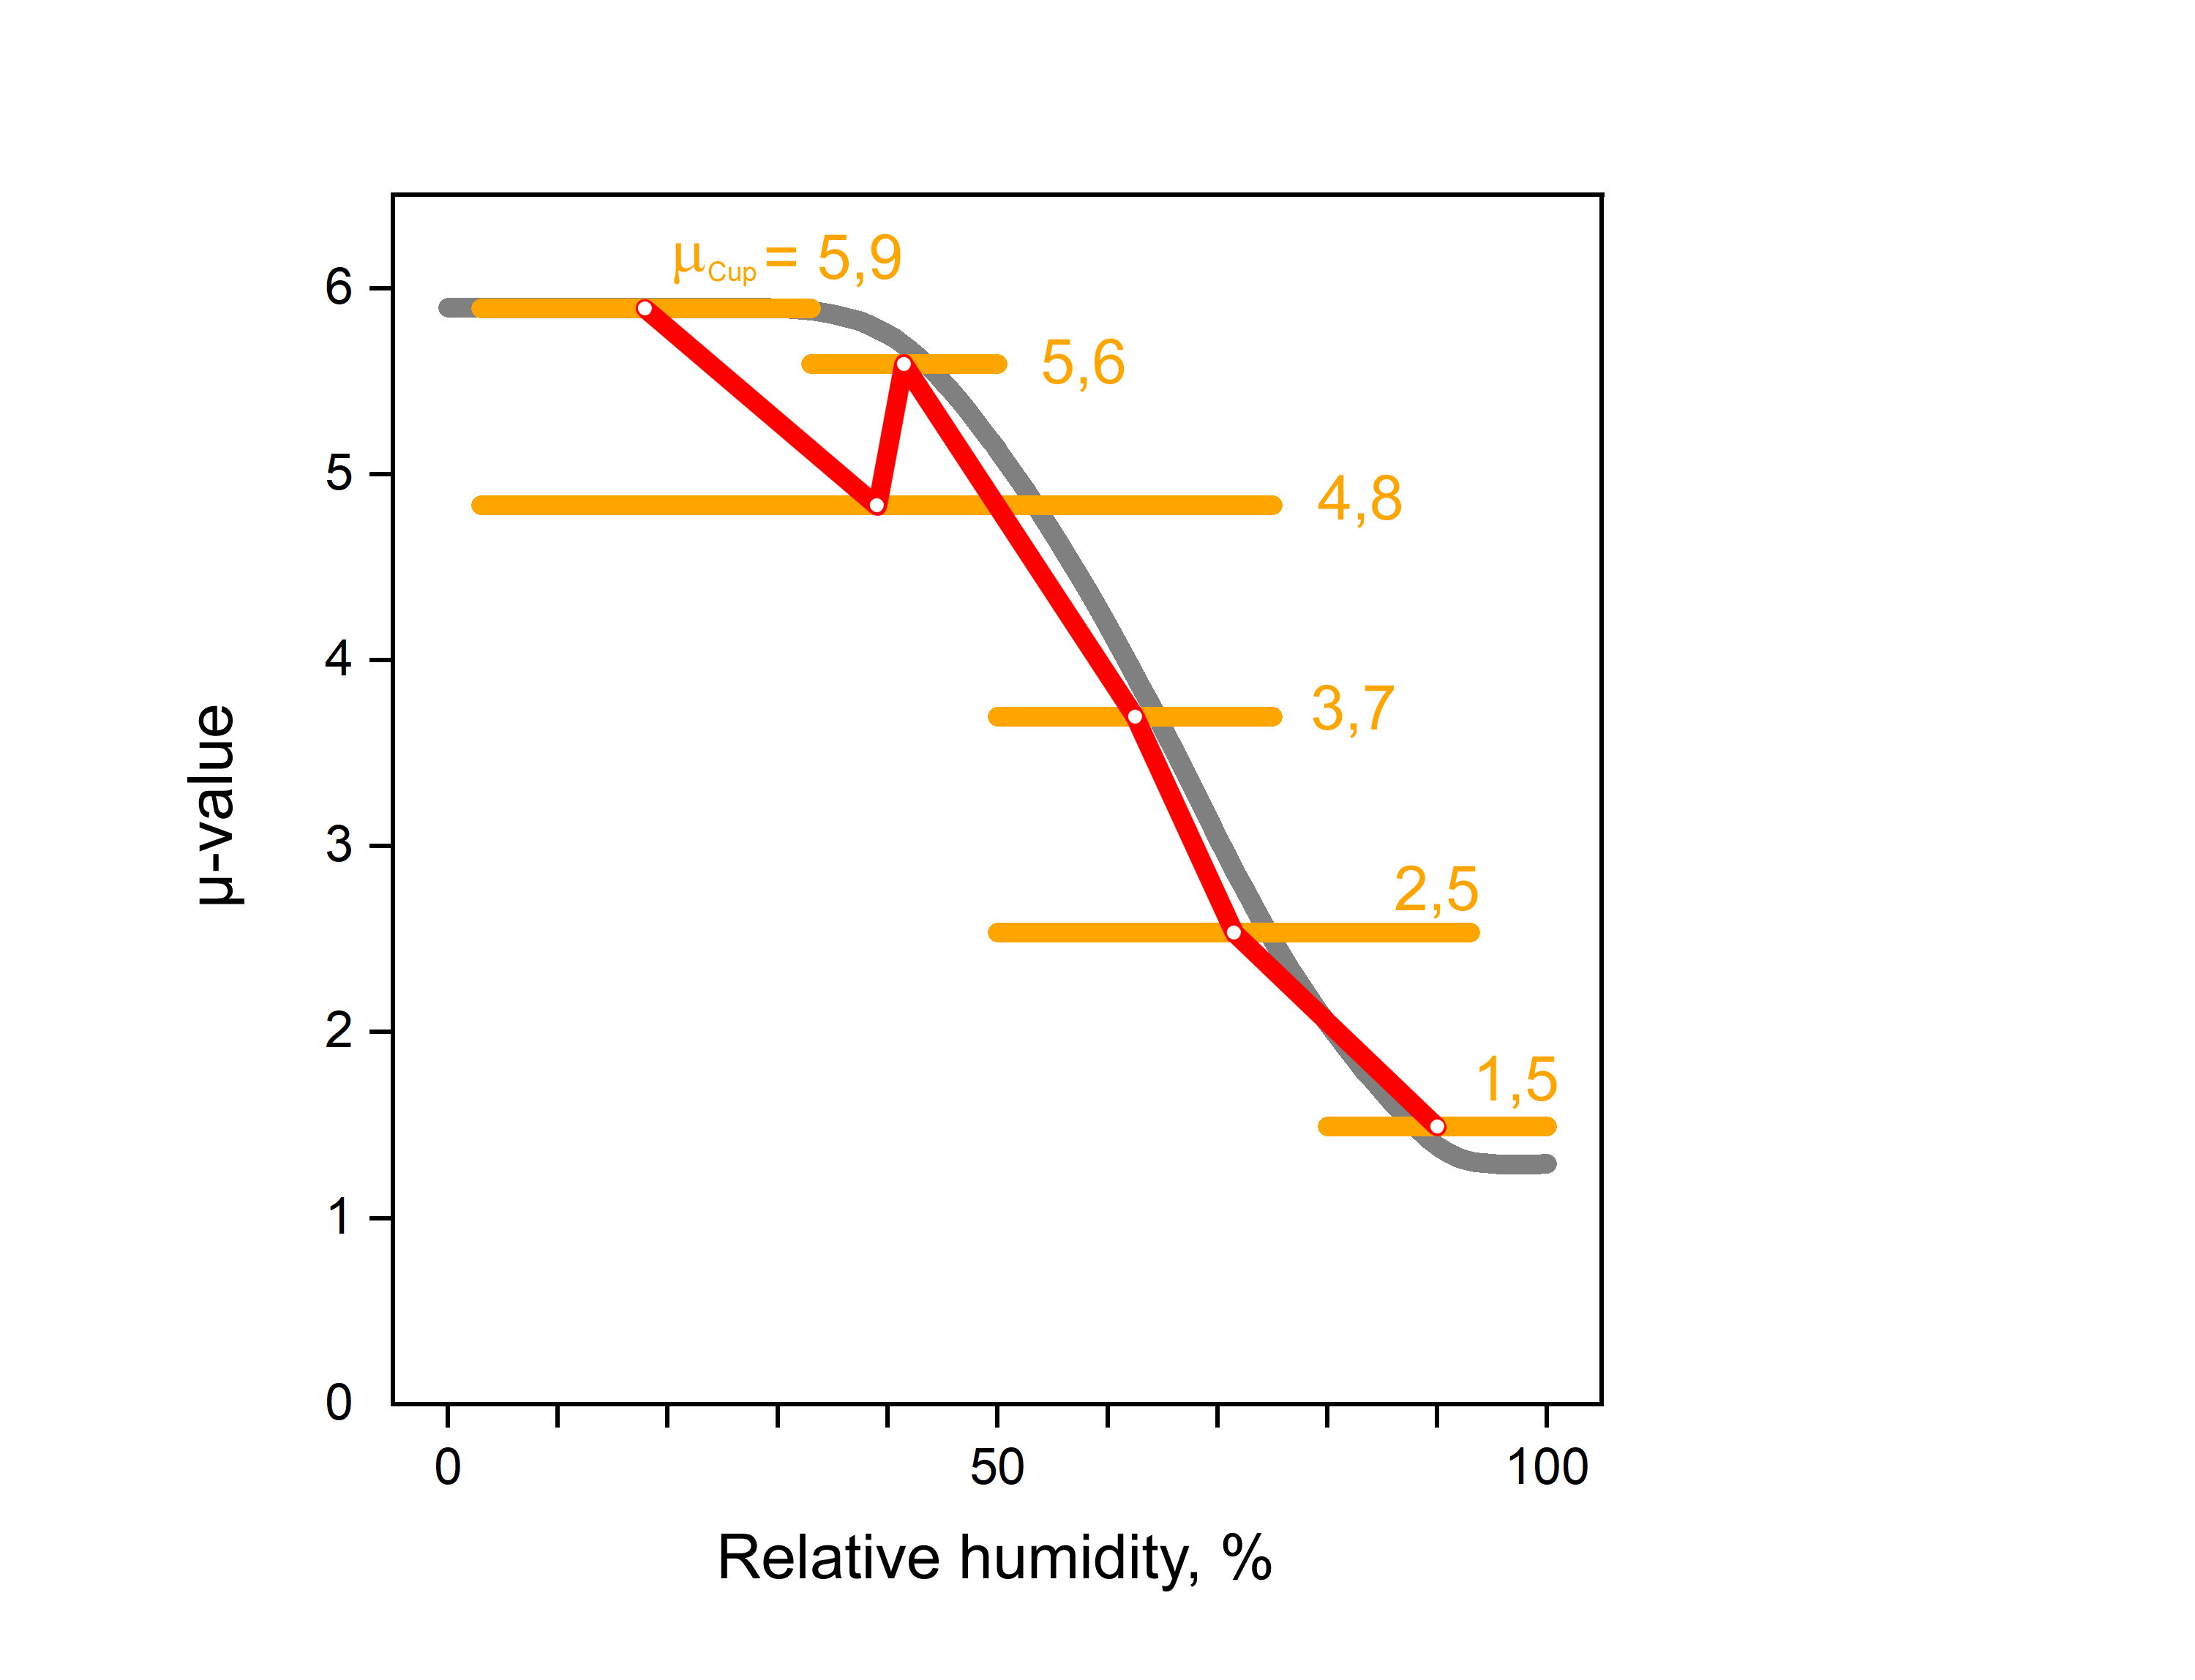
Besides the partly misleading curve shape, the red curve in general also deviates numerically from the original curve, so that it cannot even be used to reproduce the underlying cup measurements themselves by hygrothermal simulations. In the case of modern, highly variable moisture retarders, the deviation between simulations based on the erroneous µ-curve and the original measurements may reach a factor two or three.
The task is therefore to create a curve in such a way that the mean values of certain curve regions match the desired values. One way to do this is to use a polyline – a curve composed of straight-line segments – as a test curve and to adjust these segments until the target mean values are reached as closely as possible. Due to experimental uncertainties in the cup measurements, exact agreement may not always be possible for all the mean values. In this case the best-fitting curve in the sense of least squares is determined.
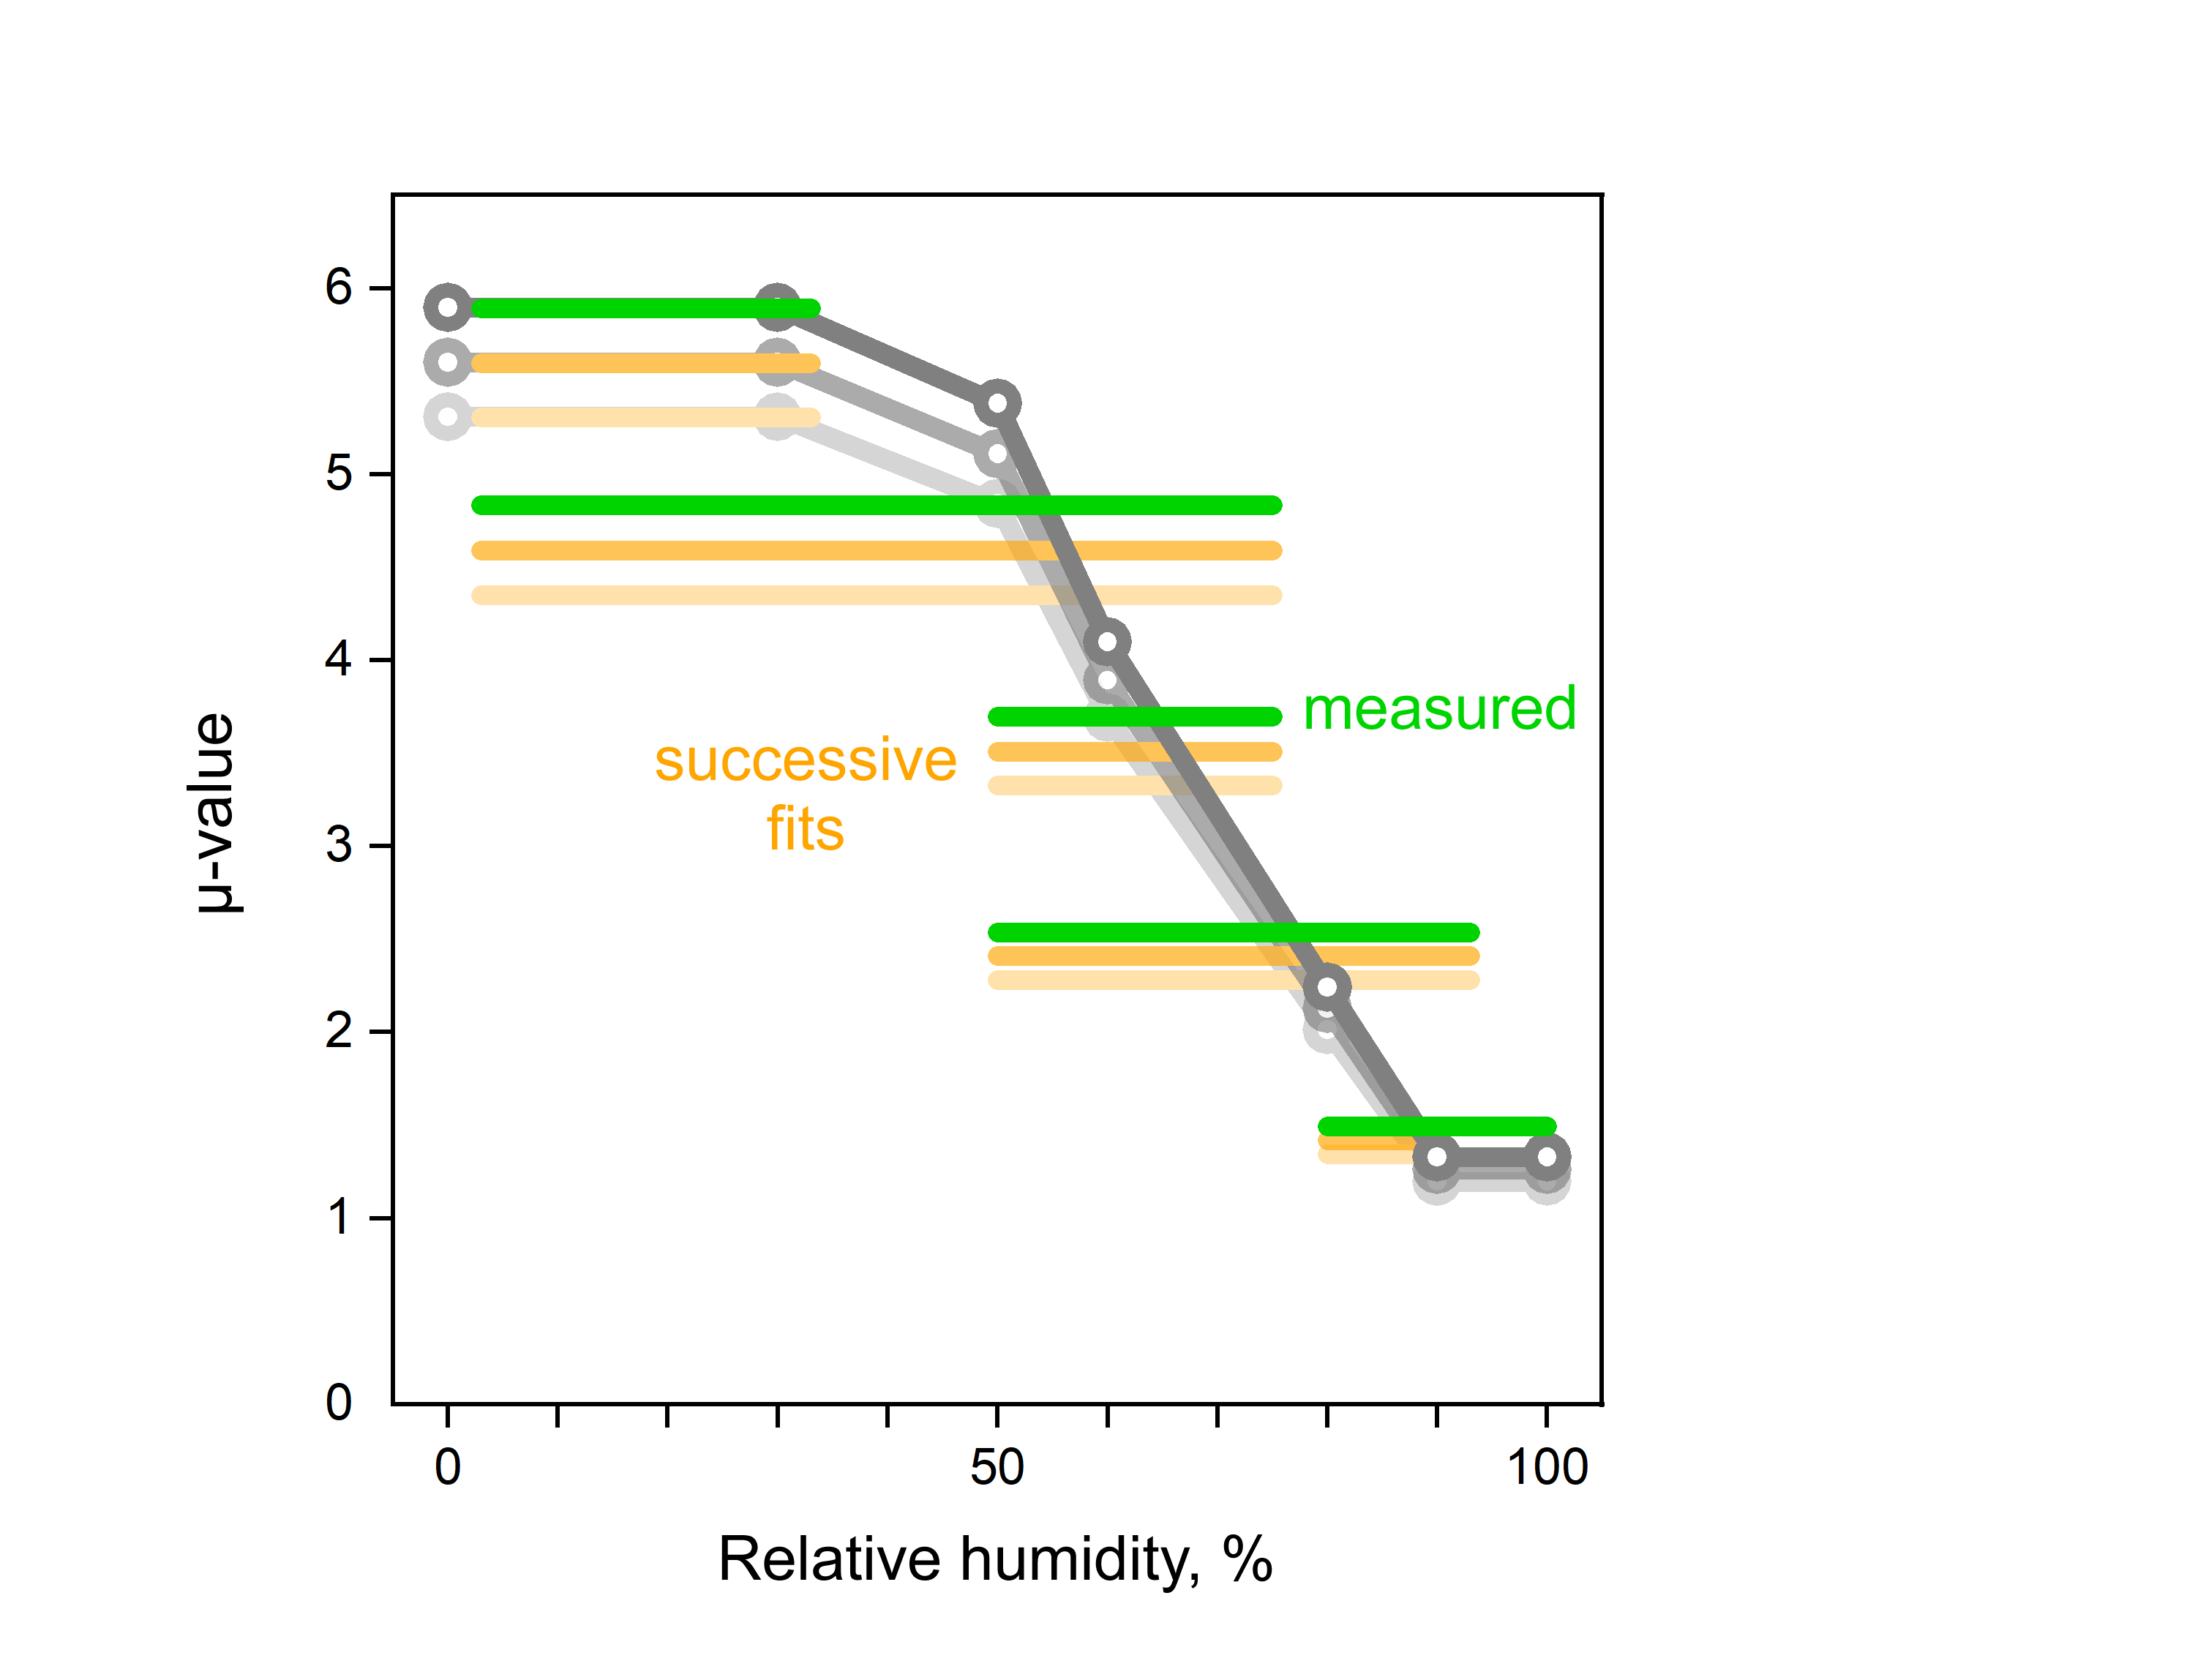
The more moisture ranges are available for the analysis, the more detailed and reliable the shape of the resulting µ-curve will be. The beginning and the end of the resulting curve are determined with less certainty. In order to avoid uncertain extrapolation, the first and the last segment of the polyline may be set constant.
The number and location of the polyline nodes can be chosen to allow the best possible representation of the curve as based on the available data. The node points of the resulting curve can directly be used for tabulating the curve, for example in WUFI.
Last Update: