Release WUFI® Pro 6.5.2 and WUFI® 2D 4.3.2

New versions of WUFI® Pro 6.5.2 and WUFI® 2D 4.3.2 with extended material and climate database are now available.

Users of WUFI® Pro 6 and WUFI® 2D 4 can download the update free of charge. You can use the link you received with your purchase of WUFI® Pro 6 or WUFI® 2D 4. You will also find the link in your account in our online shop under “My Orders”.

When buying a new license of WUFI® Pro or WUFI® 2D, you will receive the new version of WUFI® Pro 6.5.2 or WUFI® 2D 4.3.2.
Contine reading

Release WUFI® Pro 6.3.2

WUFI Pro 6.3.2-LogoVersion 6.3 of WUFI® Pro is now available.

Users of WUFI® Pro 6 can download the update free of charge. You can use the link you received with your purchase of WUFI® Pro 6 and which is displayed in your account at our online shop in the “My Orders” menu.
When buying a new license of WUFI® Pro, you will receive the latest version WUFI® Pro 6.3.2.

New features and improvements in WUFI® Pro 6.3.2 are:

WUFI® Pro

  • Extended check of entered material data
  • Corrections in the climate dialogue
  • Minor bugfixes and corrections
Contine reading

Two-dimensional test cases of ISO 10211

WUFI® 2D computes the time-dependent temperature and moisture fields in a two-dimensional cross-section of a building component. Such a two-dimensional computation automatically includes so-called geometrical and structural thermal bridge effects. These are the effects which the component shape (e.g. a corner) and variations of the thermal properties within the component (e.g. reinforcement bars) have on the resulting temperature field. The modifications of the temperature field and the associated heat flows by thermal bridges may have important consequences for energy loss, mold growth in damp corners etc.

WUFI® 2D is not intended to compete with dedicated thermal bridge programs which usually offer more flexible modelling interfaces and provide specific thermal bridge properties. But it can investigate the effect of thermal bridges on energy losses and, in particular, on the hygric conditions in and on building components (mold growth, damage due to condensation etc.), which purely thermal programs can not.

The international standard ISO 10211 provides a series of two- and three-dimensional test cases for validating thermal bridge software. Of course, WUFI® 2D should be able to reproduce the two-dimensional test cases.


Test case 1

WUFI-2D_Benchmarktest1

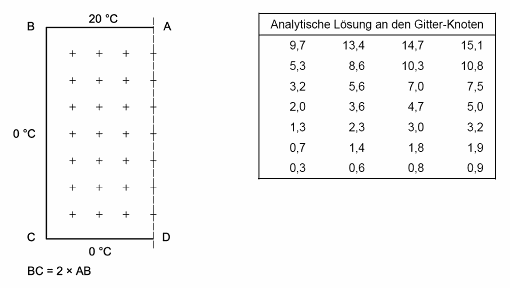
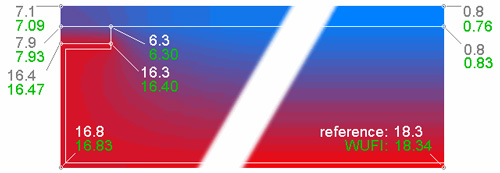
Case 1 considers one half of a symmetrical square column with known constant surface temperatures. The steady-state temperature distribution over the cross-section can be computed analytically. 28 temperatures on an equidistant grid are given by the standard as the reference solution; the software to be validated must reproduce these temperatures within 0.1° C.


500x308_WUFI-2D-Benchmark1The given boundary conditions (20° C along the top edge, 0° C along the left and bottom edges, and adiabatic along the right edge) result in a temperature field with strong variation close to the upper left corner and little variation towards the bottom of the cross-section.
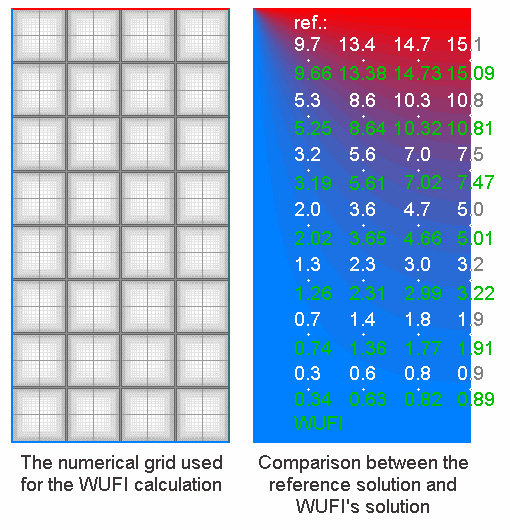
Usually, one would therefore create a more efficient variable-size computational grid with fine grid elements close to the upper left corner and progressively larger grid elements towards the bottom. However, since for the present purpose the temperatures must be evaluated at precisely given coordinates and WUFI® computes the temperatures for the centers of the grid elements, a grid has to be created which ensures that a small element is centered at each of the requested positions.
To this end, the monolithic component has been built up from 28 separate blocks which fill up the space between the reference points and are subdivided by relatively coarse grids. The blocks are separated by 4 mm wide gaps which are subdivided by very fine grids in such a way that one small grid element is precisely centered on each reference point (one at each intersection of the gaps).

Since in the present case of a monolithic component with given surface temperatures the steady-state solution for the temperature field does not depend on the thermal properties, any arbitrary material data may be used. The data of concrete were chosen for this exercise.

The prescribed surface temperatures are applied to the component by setting the ambient air to the desired temperatures and the heat transfer coefficients for the surfaces to very large values. For the adiabatic right-hand surface (the symmetry plane which allows to limit the calculation to one half of the original square column), the heat transfer coefficient has been set to zero in order to suppress any heat exchange.

WUFI® 2D has no mode for steady-state solutions, but such a solution is approached to arbitrary precision if a transient computation with constant boundary conditions is performed for a sufficient number of time steps. Here, 10 steps of 48 hours each were found to be sufficient. Moisture transport was switched off for this purely thermal computation.

A graphical postprocessor for the calculation results allows to extract the final temperatures from any grid element. The comparison with the reference temperatures shows that WUFI’s temperatures deviate by 0.05° C or less and are thus well within the allowed deviation of 0.1° C.

You can download a WUFI® 2D project file (65 KB) for the benchmark calculation. Use the “Import…” function of WUFI® 2D to read this compressed archive file.


Test case 2

WUFI-2D_Benchmarktest3

WUFI-2D_Benchmarktest4

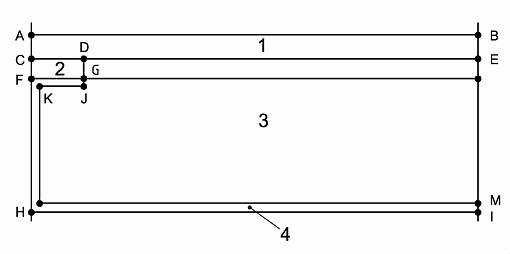
Case 2 considers the heat flow through a building component which contains materials with widely differing thermal conductivities.

Dimensions (mm):
AB= 500 CD = 15 EM = 40 IM = 1.5
AC = 6 CF = 5 GJ = 1.5 FG-KJ = 1.5


Thermal conductivities (W/mK):
1 (concrete): 1.15 2 (wood): 0.12 3 (insulation): 0.029 4 (aluminum): 230


Boundary conditions:
AB: 0° C with Rse = 0.06 m²K/W HI: 20° C with Rsi = 0.11 m²K/W

The prescribed building component can easily be assembled from rectangles, using WUFI’s graphical component editor. The automatically generated grid with the fineness setting “coarse” is sufficient for this computation.

The thermal conductivities for the four involved materials are specified by the standard and have been entered in WUFI® accordingly. Since WUFI® needs a full set of thermal porperties for each material (including heat capacity etc.) the missing data have been taken from similar materials in WUFI’s material database. The steady-state result only depends on the prescribed thermal conductivities, not on the added properties.

The ambient air temperatures and the heat transfer coefficients for the top and bottom surfaces are entered in WUFI® 2D as specified by the standard. The left and right surfaces are treated as adiabatic by setting the respective heat transfer coefficients to zero.

In this case, too, the steady-state solution must be approximated by a transient calculation with constant boundary conditions. 30 steps of one hour each were found sufficient.

500x173_WUFI-2D-Benchmark2

The resulting temperatures at the specified locations can again be extracted with the graphical postprocessor. However, the standard asks for temperatures on material boundaries whereas WUFI® computes the temperatures for the centers of the grid elements and any material boundaries must always coincide with boundaries between grid elements. So in this case it is not possible to center grid elements on the requested locations (such grid elements would contain two or more different materials which is not allowed).

Close to the four corners (points A, B, H and I), the temperature variation is so small that the center of the outermost grid element instead of the true geometric corner can be taken as sufficiently representative.

Where the requested location lies between two materials (points C, E and F), the temperature at this location must be computed from the temperatures at the centers of the two grid elements straddling the location. The temperature ϑm for a location m between locations 1 and 2 can be computed by ϑm = ((λ1/s1) ϑ1 + (λ2/s2) ϑ2) / ((λ1/s1)+(λ2/s2)), where ϑi is the temperature at location i, λi is the thermal conductivity between locations i and m, and si is the distance between locations i and m. Since the grid elements straddling a material boundary all have the same size, the si cancel and the expression reduces to ϑm = (λ1 ϑ1 + λ2 ϑ2) / (λ12).

For locations where three materials meet (points D and G), the temperature has been computed from the temperatures in the four adjacent grid elements by the following generalisation of the above formula: ϑm = (λ1 ϑ1 + λ2 ϑ2 + λ3 ϑ3 + λ4 ϑ4) / (λ1 + λ2 + λ3 + λ4).

The comparison with the reference temperatures shows that WUFI’s temperatures deviate by 0.1° C or less and are thus within the allowed deviation of 0.1° C. The heat flow through the component is 9.5 W/m and thus within the required (9.5 ± 0.1) W/m.

You can download a WUFI 2D project file (30 KB) for the benchmark calculation. Use the “Import…” function of WUFI® 2D to read this compressed archive file.


Last Update: March 18, 2024 at 9:42

Benchmark test of EN 15026

European standard EN 15026 provides minimum criteria for simulation software used to predict one-dimensional transient heat and moisture transfer in multi-layer building components exposed to transient climate conditions on both sides.

The standard lists model equations and pertinent material properties which shall be used for computing heat and moisture transport phenomena. These model equations allow for the following storage and transport phenomena:

  • heat storage by the dry materials and the absorbed water,
  • heat transport by moisture-dependent thermal conduction,
  • latent heat transfer by vapor diffusion,
  • moisture storage by vapor sorption and capillary forces,
  • moisture transport by vapor diffusion,
  • moisture transport by liquid transport (surface diffusion and capillary flow),

and the following boundary conditions:

  • indoor and outdoor temperature,
  • indoor and outdoor humidity,
  • solar and long-wave radiation,
  • precipitation (normal and driving rain),
  • wind speed and direction.

Furthermore, the standard adopts several simplifying assumptions; for example, swelling and shrinking processes, chemical reactions and ageing processes are ignored, the moisture storage function is treated as independent of temperature, etc.

WUFI® complies with all requirements of standard EN 15026.

Benchmark Example

Standard EN 15026 defines a benchmark example for validating hygrothermal simulation software. It is designed to ensure that the software meets some basic requirements and produces results which are correct within a specified tolerance. The example considers the heat and moisture absorption of a semi-infinite slab of material which initially is in equilibrium with the boundary conditions ϑ = 20°C, φ = 50% and then is subjected to the new conditions ϑ = 30°C, φ = 95%.

The sudden increase of the temperature and moisture content at the surface causes heat and moisture to flow into the material. The temperature and moisture profiles resulting after 7, 30 and 365 days are to be calculated. The results of the software under test must not deviate from the reference solution by more than 2.5 %.

WUFI’s results for the benchmark example are virtually identical with the reference solution (see diagrams), it therefore complies with the requirements established by EN 15026.

You can download a WUFI Pro project file (WUFI® Pro 4 (25kB), WUFI® Pro 5 (11kB) oder WUFI® Pro 6 (11kB)) for the benchmark calculation. An accompanying PDF file (513 KB) states WUFI’s compliance with EN 15026 and documents how the benchmark specifications have been translated for use with WUFI® .

500x308_WUFI-Pro-Benchmark1 500x308_WUFI-Pro-Benchmark2


Last Update: March 18, 2024 at 9:42

Assessment of mold growth risk

Assessment of mold growth riskUnder unfavorable ambient conditions, microbial growth may occur on the surfaces of building components. The most important factors are temperature, relative humidity, a substrate with sufficient nutrients and the daily duration of the period where all growth conditions prevail simultaneously (coincidence time). While bacteria need relative humidities of at least 90% for being able to grow, certain xerophilic fungi can thrive at humidities as low as 65%, and most fungi can cope with humidities as low as 80%. Mold fungi also tolerate a larger temperature bandwidth than other organisms, they may grow between 0°C and 50°C. Therefore the whole range of humidities and temperatures mentioned above may be considered to pose a potential mold growth risk.

Fig. 1 shows a qualitative assessment of the growth conditions for mold in dependence of the above factors. These functional relationships served as the basis for a prediction method for assessing the mold growth risk which has already been applied repeatedly and has been validated by comparison with experiment [1]. The input data are the local temperature and humidity conditions resulting from a non-steady simulation. The influence factors are combined by fuzzy logic which allows for the natural uncertainty inherent in specifying e.g. the humidity interval favorable for growth. The output of the assessment is a measure for the amount of mold growth to be expected. Current work is aimed at extending the above non-steady method to create an encompassing safety concept as has been called for and developed in a steady-state version by [2].

Literature

Sedlbauer, K.; Oswald, D.; König, N.: Schimmelgefahr bei offenen Luftkreisläufen. Vorstellung einer Prognosemethode auf der Basis von Fuzzy-Algorithmen. Gesundheits-Ingenieur, Heft 5 (1998), S. 240 – 247.
Cziesielski, E.: Schimmelpilz – ein komplexes Thema. Wo liegen die Fehler? wksb 44 (1999), H. 43, S. 25 – 28.


Page created: 14 May 2007; last update: 17 Jul 2012

Retrofitting Interior Insulation to a Pitched Roof

Retrofitting Interior Insulation to a Pitched RoofConverting attic space into living space becomes increasingly popular. Since the unvented type of insulation is energetically more favorable and since this type is easier to install if the insulation has to be added to an existing roof, it should be preferred over a vented variant, unless possible moisture problems are a concern. Since older pitched roofs usually have a relatively vapor-tight exterior lining (e.g. bituminous roofing felt on wood sheathing) they require an analysis of possible condensation problems. German standard DIN 4108-3 dispenses with calculational approval if the room-side vapor barrier has a very high vapor resistance (sd-value > 100 m). However, because such constructions which are then vapor-tight on both sides run a considerable risk of severe moisture damage if small defects or leaks occur, it is advisable not to follow the standard here as was already correctly pointed out in [1]. It has also been recommended there to use vapor retarders instead whose diffusion resistance has been selected to limit condensation in winter to an uncritical level while some drying of moisture that has infiltrated in the component is allowed in summer.

This is a typical optimization problem which clearly demonstrates the advantages of computational simulation. If the traditional Glaser method is used for this, a minimum sd-value of about 2 m is found. However, the Glaser method only approves the construction if the prescribed boundary conditions for roofs are used (surface temperature 20 °C). If the boundary conditions for walls are used, then the amount of condensing moisture usually exceeds the amount of evaporating moisture and the construction fails the Glaser test. Whether a high-pitched roof facing north can be assessed more realistically using the boundary conditions for flat roofs exposed to sunshine or boundary conditions for walls is left to the judgement of the person in charge. In the following it will be shown which insight can be gained with WUFI calculations.

The effect of different boundary conditions and diffusion properties of the vapor retarder on the moisture situation in the north-facing half of an unvented double-pitch roof (inclination 50°) with vapor-tight exterior lining and insulation applied between the rafters has been investigated by computational simulation (see [2]). Fig 1 shows the evolution in time of the total moisture content in this roof for three different sd-values of the vapor retarder, assuming normal indoor moisture load, exterior climate conditions typical for Holzkirchen and an initial hygroscopic equilibrium moisture corresponding to 80% RH. If the vapor retarder has an sd-value of 0.5 m, the roof absorbs about 1.5 kg/m² of moisture from the indoor air in winter and completely releases it during the next summer, with the total water content at the end of the evaluation period of six years corresponding approximately to the initial water content. However, the high moisture accumulation in winter exceeds the limit for maximum condensation set by standard DIN 4108 and cannot be tolerated because the condensation moisture might collect and run off. If the sd-value of the vapor retarder is increased by a factor of ten, the moisture increase remains well below the critical limit of 0,5 kg/m². But now the moisture accumulates in the long term, as evidenced by the slow year-by-year increase of the computed moisture contents. A possible solution for this situation is a vapor retarder with variable sd-value, whose moisture-adaptive properties make it more vapor-tight in winter than in summer. Such a vapor retarder combines a low moisture increase by condensation in winter with a high drying potential in summer, so that the moisture content at the end of the evaluation period is even lower than in the other cases.

Specifications devised by extensive WUFI calculations were used to guide the development of this unique vapor retarder, providing another example for successful application of hygrothermal simulations to the development and optimization of building products [3].


Literature

Schulze, H.: Hausdächer in Holzbauart. Werner-Verlag, Düsseldorf 1987.
Künzel, H.M.: Bedeutung von Klimabedingungen und Diffusionseigenschaften für die Feuchtesicherheit voll gedämmter Altbaudächer. Festschrift zum 60. Geburtstag von Prof. Gertis. Fraunhofer IRB Verlag, Stuttgart 1998, S.371-389.
Künzel, H.M. und Kasper, F.-J.: Von der Idee einer feuchteadaptiven Dampfbremse bis zur Markteinführung. Bauphysik 20 (1998), H.6, S.257-260.


Page created: 10 May 2007; last update: 17 Jul 2012

Construction Moisture in a Cellular Concrete Flat Roof

onstruction Moisture in a Cellular Concrete Flat RoofThe drying of a cellular concrete flat roof is a classic example for the application of modern computational simulation methods. Since traditional methods considering only vapor diffusion were not sufficient to explain the drying behavior of these flat roofs, a new calculation method [1] was introduced in the early 80s which allowed for capillary transport, too, and was thus able to quantitatively reproduce experimental results obtained in the 60s [2]. Since this type of construction has recently attracted the attention of experts because of moisture problems during the drying phase in more southern climates, it will be used here as an example for investigating the hygrothermal behaviour of massive flat roofs.

Fig. 1 shows the computed drying curves for three different flat roof variants, each starting with 20 vol-% of construction moisture in the prefabricated cellular concrete elements at the beginning of the first year. A comparison of the computation with measurements obtained for the 15 cm thick roof [2] shows the quality of the calculational prediction. The initial strong drying by 10 vol-% (15 kg/m²) within six months is due to strong heating of the bituminized roof surface by solar irradiation.

Since the roof can only dry towards the indoor side, a strong moisture load on the indoor air is created which must be removed promptly. While at temperate latitudes this is routinely achieved by simply opening the windows for an appropriate period of time, the air conditioning equipment used in hot and humid climate zones often cannot cope with the additional moisture so that indoor humidity may exceed permissible levels during the drying period of the roof.

The designed U-value of the roof is only reached when its moisture content falls below the reference moisture content of cellular concrete (about 1.5 vol-%). With the 15-cm-thick roof this happens within less than two years. A 20 cm thick cellular concrete roof already takes 3.5 years to dry out, which is roughly double the time. If 6 cm of polystyrene insulation are applied on top of the latter roof, its drying time reaches approximately five years. This example demonstrates the considerable influence of solar irradiation on the moisture behavior of flat roofs. While the additional insulation raises the overall temperature level of the cellular concrete, it also strongly suppresses the surface temperature peaks in summer. Since saturation vapor pressure rises exponentially with temperature, this reduction of peak temperatures slows the diffusion-dominated drying following the initial moisture loss which is supported by capillary forces.


Literature

Kießl, K.: Kapillarer und dampfförmiger Feuchtetransport in mehrschichtigen Bauteilen; rechnerische Erfassung und bauphysikalische Anwendung. Diss. Universität-Gesamthochschule Essen 1983.
Künzel, H.: Untersuchungen über die Feuchtigkeitsverhältnisse in Flachdachkonstruktionen. Berichte aus der Bauforschung H. 48, Verlag Ernst & Sohn, Berlin 1966


Page created: 09 May 2007; last update: 17 jul 2012

Driving Rain Moisture in Fair-faced Brickwork with Interior Insulation

Driving Rain Moisture in Fair-faced Brickwork with Interior InsulationFrom a hygrothermal point of view, an exterior insulation is in general preferable over an interior insulation. However, economical aspects or the wish to preserve historical facades may rule out exterior insulation, so that interior insulation remains the only way to reduce the energy consumption of a building and to increase comfort. The resulting risk of interstitial condensation and possible countermeasures (e.g. vapor barriers) are widely known.

It is less well known, however, that an interior insulation affects the moisture content of a facade exposed to rain and may increase the risk of frost damage. The influence of this effect on the moisture behaviour of a fair-faced solid-brick masonry wall exposed to driving rain has been investigated by computational simulation in [1] and has been verified by accompanying open-air experiments. Fig. 1 shows the moisture conditions in a 40-cm-thick masonry wall without and with interior insulation after periodic equilibrium has been reached (that is, the simulation is run for several years, always applying the same yearly weather data, until the transient moisture profiles repeat from one year to the next). The blue area shows the bandwidth of the moisture contents occuring during one year, plotted over the cross-section of the walls. The dark curve describes the yearly averages of the moisture contents for the region between the exterior surface of the wall and the point close to the interior surface where the interior rendering or the polystyrene foam insulation begins.

Despite recurring water saturation of the facade during periods of intense driving rain, the average moisture content at the exterior surface corresponds roughly to the reference moisture content of the masonry because sunshine quickly dries the surface. Due to the strong moisture-dependence of capillary transport, however, deeper below the surface the average moisture content increases quickly. In the wall without interior insulation, the moisture content reaches a maximum at a depth of a few centimeters and then decreases quite smoothly until it reaches the hygroscopic dry level on the indoor side. Beyond a depth of about 20 cm, the moisture content shows no variation over the whole year, that is, the transient outdoor climate only affects the exterior half of the masonry.

Applying an interior insulation changes the moisture conditions in the masonry drastically. Below the exterior surface, the moisture content now increases even stronger, without ever decreasing towards the indoor side. There are two reasons for this: while the driving rain load has not changed, the diffusion resistance of the polystyrene insulation slab impedes the drying through the indoor surface, and in addition the average temperature level of the masonry is reduced by the insulation, so that drying towards the exterior side is slowed down, too. In comparison with the uninsulated case the total moisture content in the insulated wall is noticeably increased. The risk of frost damage is increased accordingly and can only be reduced by improved rain protection such as hydrophobic facade treatments [1].

Literature

Künzel, H.M. und Kießl, K.: Feuchte- und Wärmeschutz von Sichtmauerwerk mit und ohne Fassadenhydrophobierung. Mauerwerksbau aktuell 98 (1998) S. D48-D57.


Page created: 09 May 2007; last update: 17 Jul 2012